Aerodynamic Analysis Tool
Interactive tool for analyzing airfoil performance using panel methods and thin airfoil theory. Calculates lift, drag, and moment coefficients across a range of angles of attack with viscous corrections.
Project Details
Technologies
MATLAB, Aerodynamics, GUI
Category
Aerospace Engineering
Status
Completed
Institution
TU Delft
Key Features
- Panel methods for airfoil analysis
- Thin airfoil theory calculations
- Lift, drag, and moment coefficient computation
- Viscous corrections for improved accuracy
Project Overview
The Aerodynamic Analysis Tool provides a comprehensive suite of capabilities for airfoil performance prediction. Developed in MATLAB with a graphical user interface, it enables rapid evaluation of different airfoil designs without requiring expertise in computational fluid dynamics.

The tool addresses a common need in aerospace education where students require quick aerodynamic analysis capabilities but commercial CFD software is either unavailable or too complex for basic airfoil studies. This solution bridges that gap with an accessible yet technically rigorous approach.
Users can input airfoils from the NACA 4-digit and 5-digit series using parametric definitions, or import custom airfoil coordinates from standard Selig format files. The extensive UIUC airfoil database compatibility ensures access to thousands of documented airfoil designs.
Panel Method Implementation

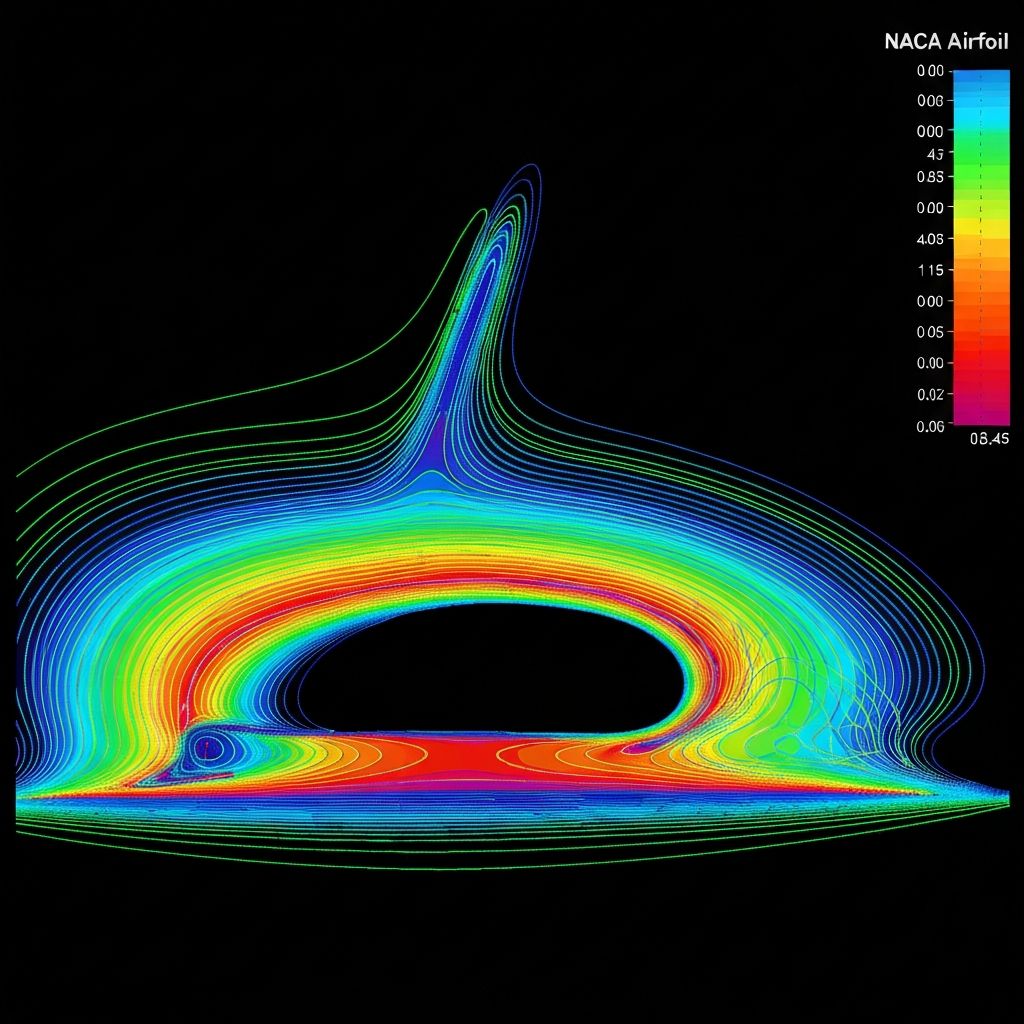
At the core of the tool is a constant-strength vortex panel method that discretizes the airfoil surface into linear panels. Each panel carries a vorticity distribution that satisfies the flow tangency boundary condition, ensuring no flow passes through the airfoil surface.
The Kutta condition is enforced at the trailing edge by requiring equal and opposite vorticity on the upper and lower surface panels, ensuring smooth flow departure and finite circulation. This condition is essential for obtaining physically realistic lift predictions.
The resulting linear system is solved using standard matrix methods, yielding the circulation distribution and hence the pressure coefficient at each panel. Integration of the pressure distribution gives the lift and pitching moment coefficients.
Viscous Corrections
While panel methods capture inviscid flow physics accurately, real airfoils experience viscous effects that significantly impact performance. The tool incorporates boundary layer calculations using integral methods to predict skin friction drag and flow separation.

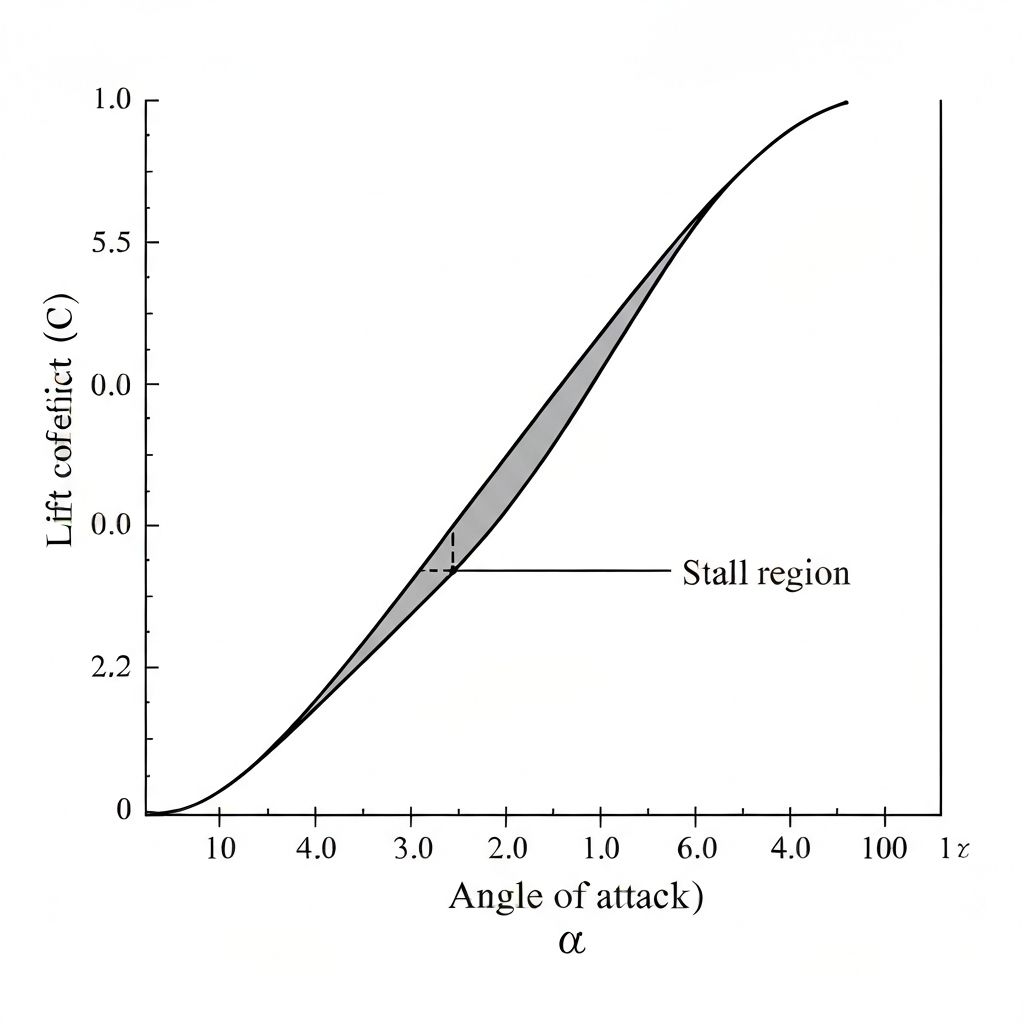
Transition prediction uses empirical correlations based on the pressure gradient and Reynolds number, identifying where the laminar boundary layer becomes turbulent. This transition location critically affects both drag and maximum lift capability.
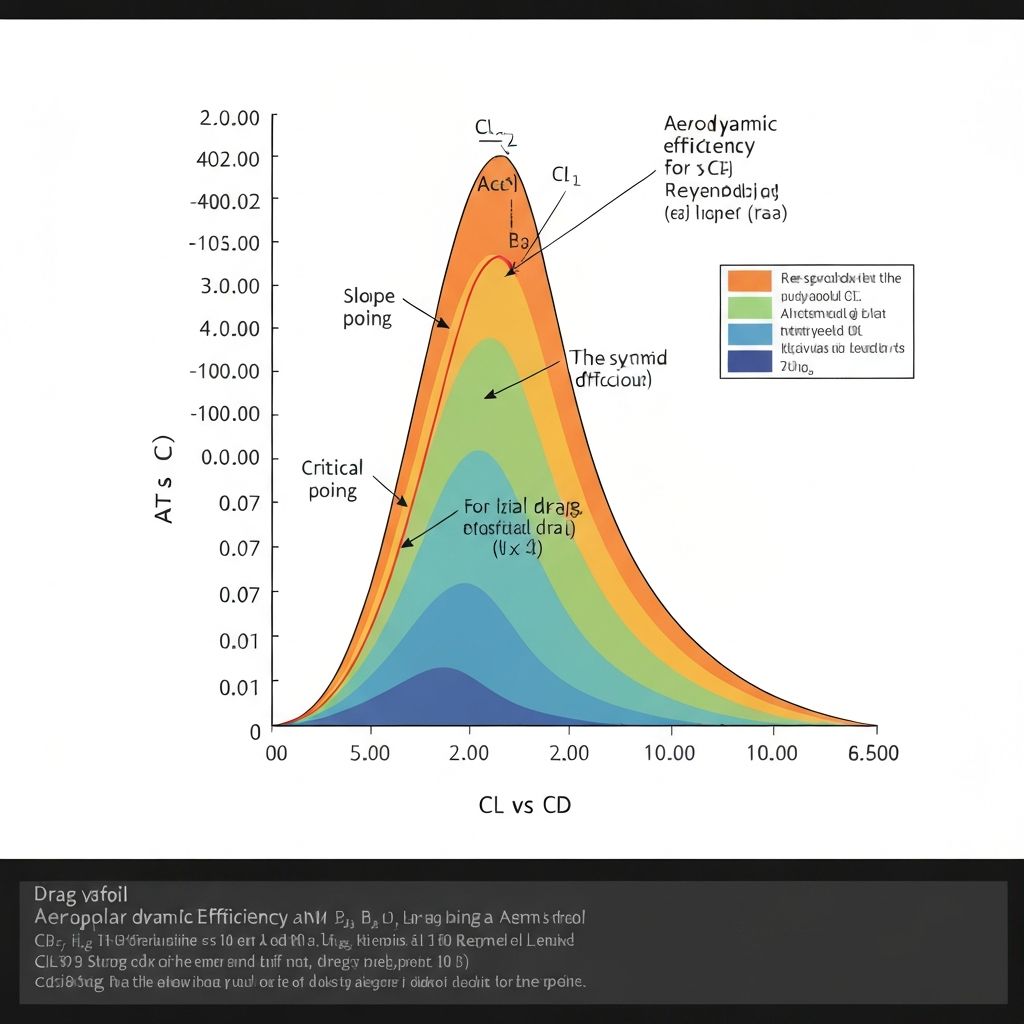
The combination of inviscid panel results with viscous corrections produces drag polars that show excellent agreement with experimental wind tunnel data across a wide range of Reynolds numbers and angles of attack.
User Interface and Visualization
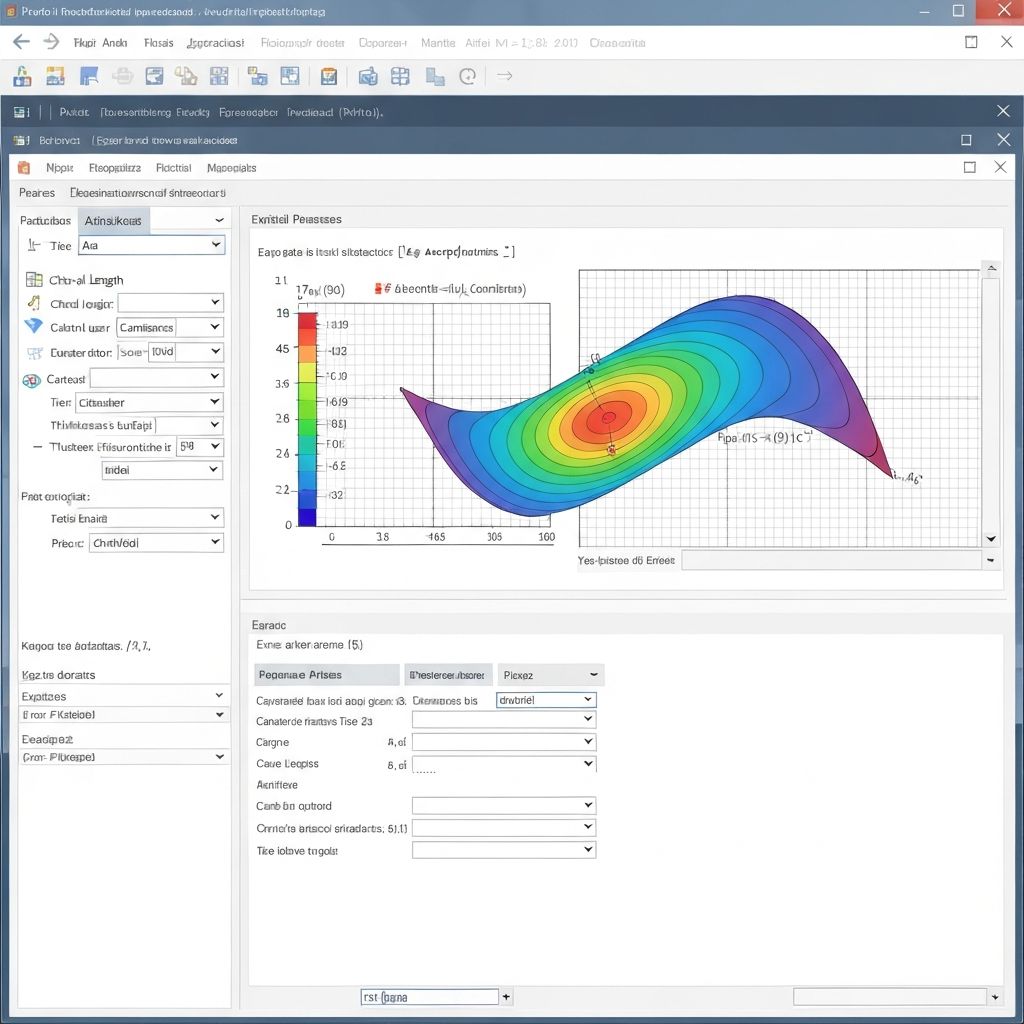
The MATLAB GUI provides an intuitive workflow for airfoil analysis. Users select or define an airfoil, specify flow conditions (Reynolds number, Mach number), and execute the analysis with a single button click. Results appear immediately in integrated plot windows.
Visualization options include pressure distribution plots, velocity vector fields, and polar diagrams showing lift, drag, and moment coefficients versus angle of attack. All plots can be exported in publication-quality formats for use in reports and presentations.