16.6 million data points analysed
Availability Analysis of a Free Space Optical Communication Link in Delft, Netherlands
PythonResearchData AnalysisUnder Review
Project Overview
The radio-frequency (RF) spectrum is becoming increasingly congested, with most bands requiring licensing and capacity approaching its limits. Free Space Optical Communication (FSOC) offers a compelling alternative — using focused laser beams to transmit data at high bandwidths with no spectrum licensing requirement. However, FSOC performance is highly sensitive to atmospheric turbulence, which varies significantly by geographic location and remains under-researched for mid-latitude European environments.
This project, carried out as a group research effort at TU Delft, analyses seasonal and daily variations in FSOC link availability in Delft, the Netherlands, using measurement data collected directly from the rooftop of the Aerospace Engineering faculty building. The study evaluates both a horizontal ground-to-ground link and a vertical ground-to-satellite link, producing month-by-month availability rankings and validating a theoretical atmospheric model against observed data.
Dataset & Measurement Setup
Two complementary measurement setups were used. For the horizontal link, a scintillometer measured the refractive index structure constant (C²ₙ) along a 950 m path between the Aerospace Engineering faculty building and Delftechpark, with readings taken every 10 minutes from November 2022 to November 2025. The C²ₙ values were converted to Rytov variance (σR2) to quantify scintillation strength.
For the vertical link, infrared and visible-light cameras on the same rooftop observed Polaris at night and the sun during the day throughout 2025, measuring the Fried parameter (r₀) — a key indicator of atmospheric coherence. Data was recorded every minute.
650+ GB of raw data
1,500+ lines of Python
Horizontal Link Results
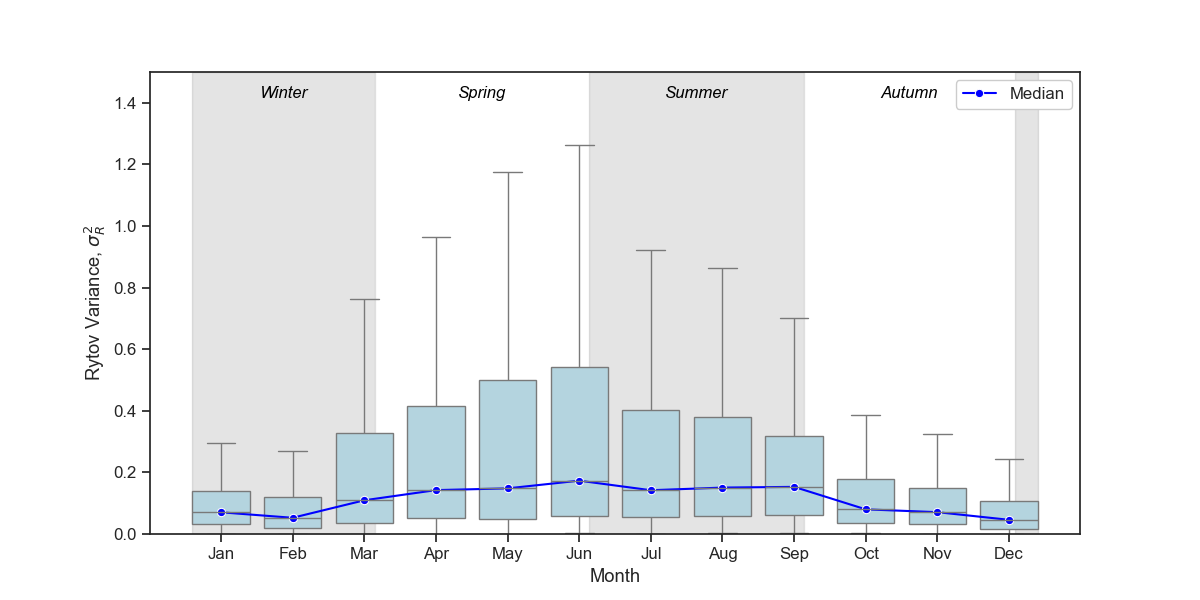
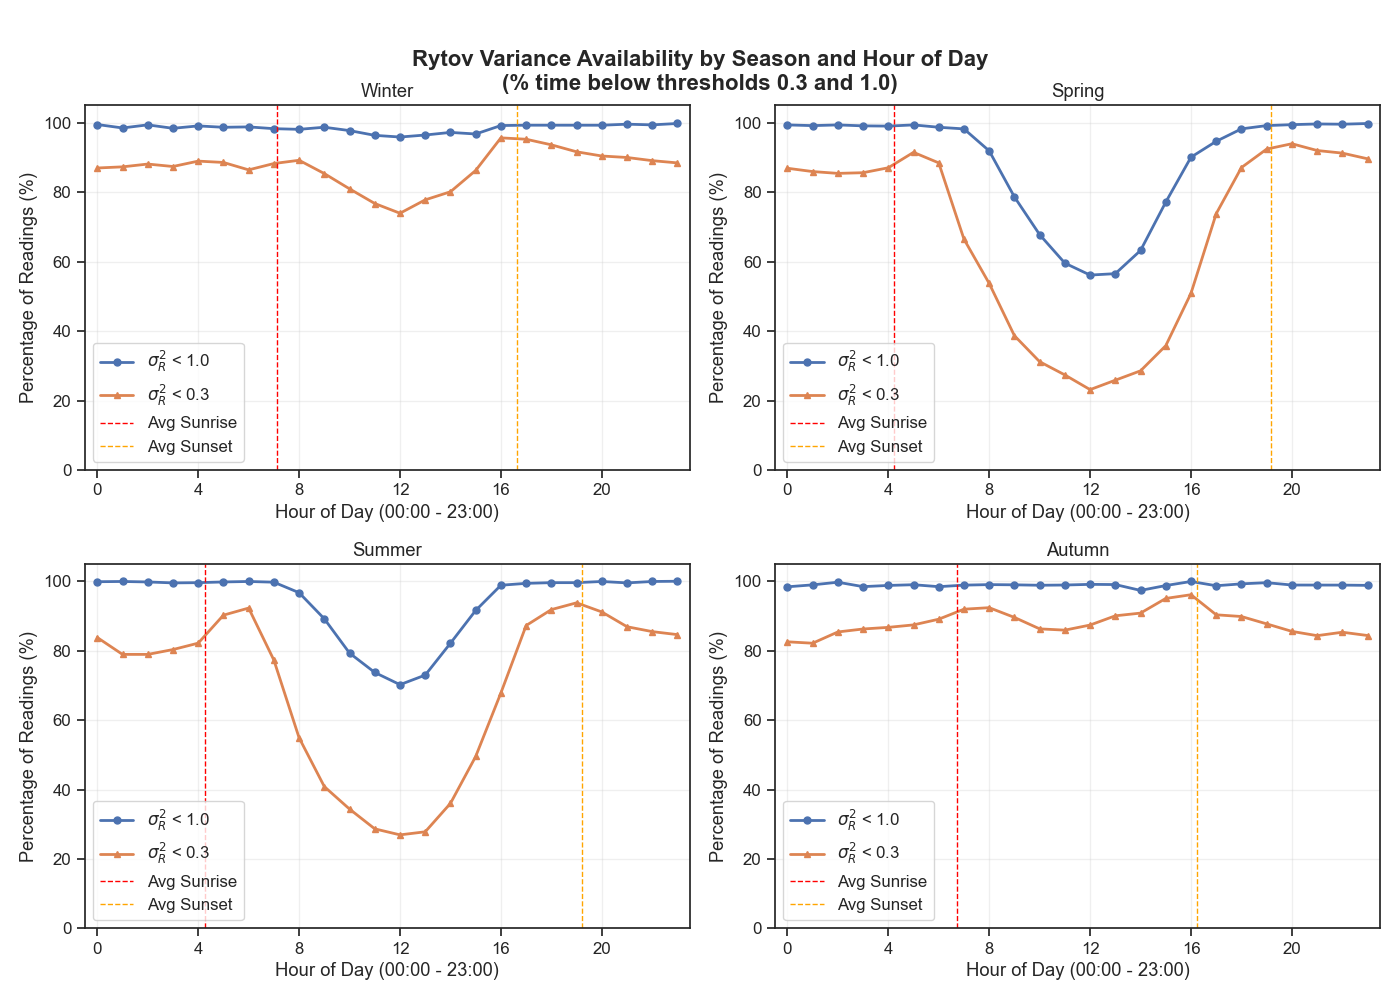
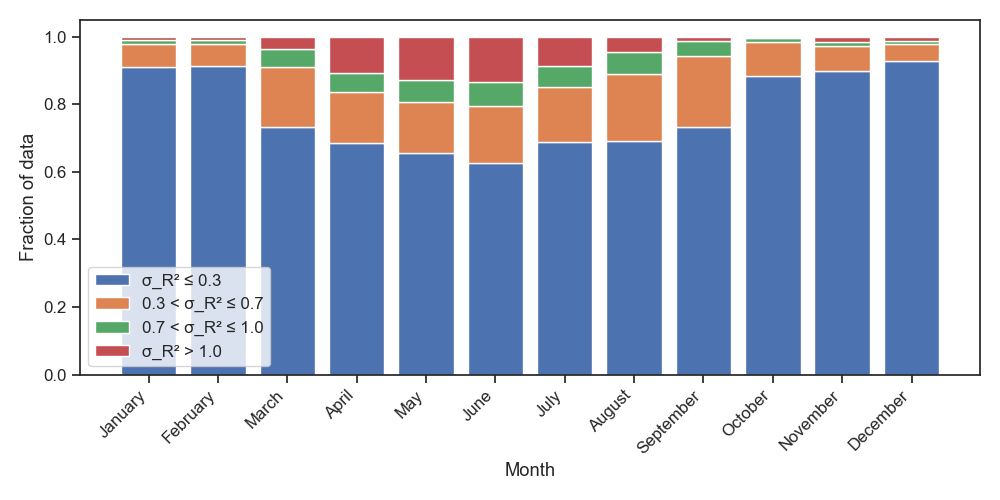
The horizontal link was evaluated using Rytov variance, with turbulence classified as very weak (σR2 < 0.3), weak (0.3–1.0), or strong (> 1.0). The analysis revealed a clear seasonal pattern: winter and late autumn consistently outperform spring and summer in terms of availability. This is driven primarily by daytime conditions — solar heating creates temperature fluctuations near the ground, forming turbulent “hot pockets” that increase scintillation. At night, availability is almost entirely independent of season, with roughly 80–85% of readings falling below σR2 = 0.3 regardless of time of year.
Monthly Availability Ranking (Horizontal Link)
Ranked by percentage of time with σR2 ≤ 0.3 (very weak turbulence):
| Rank | Month | % Time σR2 ≤ 0.3 |
|---|---|---|
| 1 | December | 92.92% |
| 2 | February | 91.40% |
| 3 | January | 90.98% |
| 4 | November | 89.73% |
| 5 | October | 88.40% |
| 6 | March | 73.29% |
| 7 | September | 73.23% |
| 8 | August | 69.12% |
| 9 | July | 68.85% |
| 10 | April | 68.54% |
| 11 | May | 65.72% |
| 12 | June | 62.60% |
Vertical Link Results
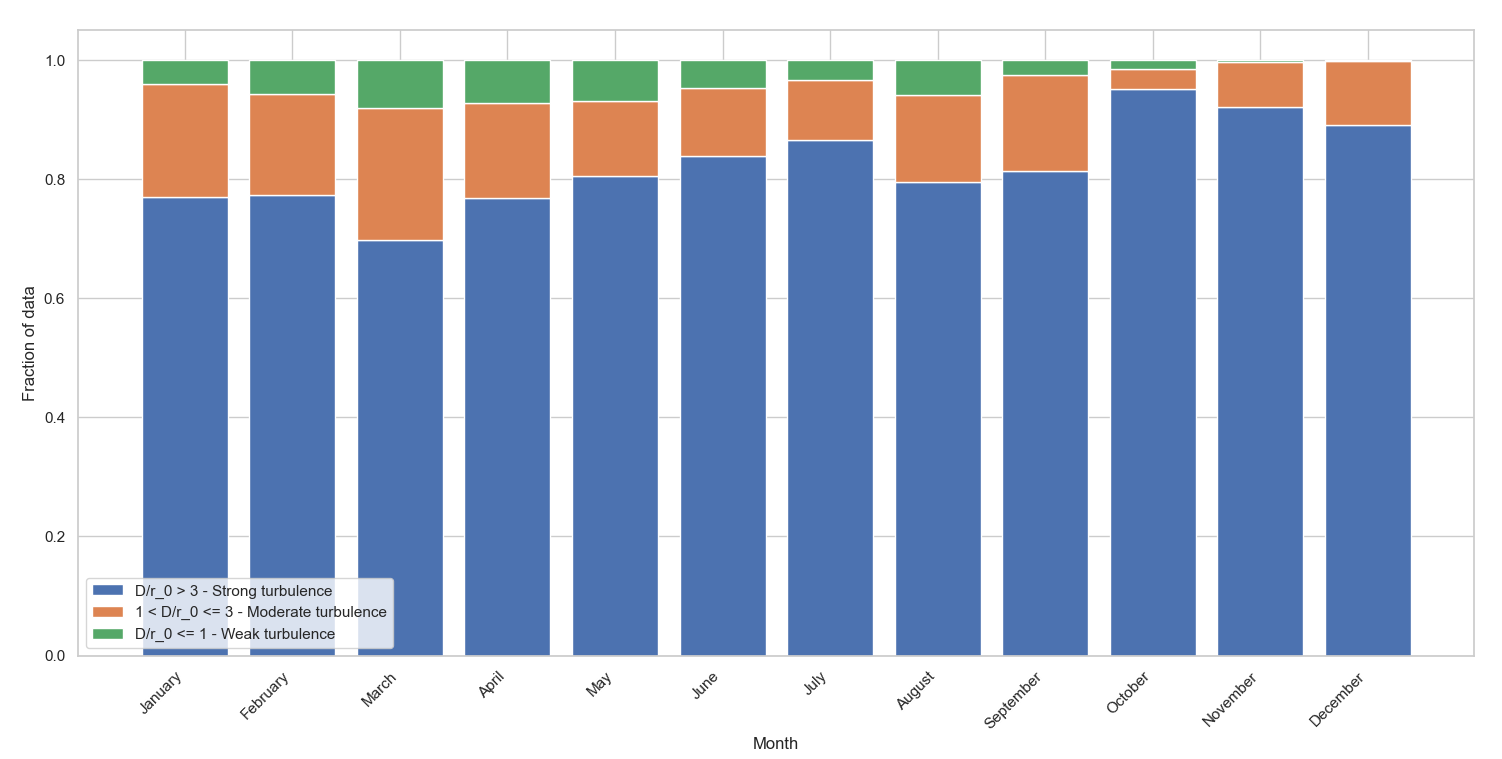
The vertical link was evaluated using the Fried parameter (r₀), with turbulence classified by the ratio D/r₀ (where D = 10 cm, the aperture of the Reuniwatt Sky InSight sensor). Unlike the horizontal link, the vertical link shows better availability during the day and in spring and summer months. This is because longer daylight hours provide more observation windows, and the vertical path through the full atmosphere is less affected by near-ground thermal convection. A significant portion of readings returned null values due to clouds, rain, or fog — these were treated as periods of unavailability in the main analysis, as they represent genuine link outages.
Monthly Availability Ranking (Vertical Link)
Ranked by percentage of time with D/r₀ ≤ 1 (weak turbulence, full availability):
| Rank | Month | % Time D/r₀ ≤ 1 |
|---|---|---|
| 1 | March | 8.07% |
| 2 | April | 7.18% |
| 3 | May | 6.94% |
| 4 | August | 5.82% |
| 5 | February | 5.78% |
| 6 | June | 4.63% |
| 7 | January | 4.06% |
| 8 | July | 3.37% |
| 9 | September | 2.52% |
| 10 | October | 1.54% |
| 11 | November | 0.40% |
| 12 | December | 0.24% |
Atmospheric Modelling
To validate whether ground-based horizontal measurements can predict vertical link performance, the Hufnagel-Valley (HV) atmospheric model was applied. Using the ground-level C²ₙ values from the horizontal scintillometer, the model estimates the variation of atmospheric turbulence with altitude and from this derives a predicted Fried parameter for the vertical link. Two versions were used: a standard daytime model (wind speed 27 m/s) and an adjusted nighttime model (wind speed 10 m/s).
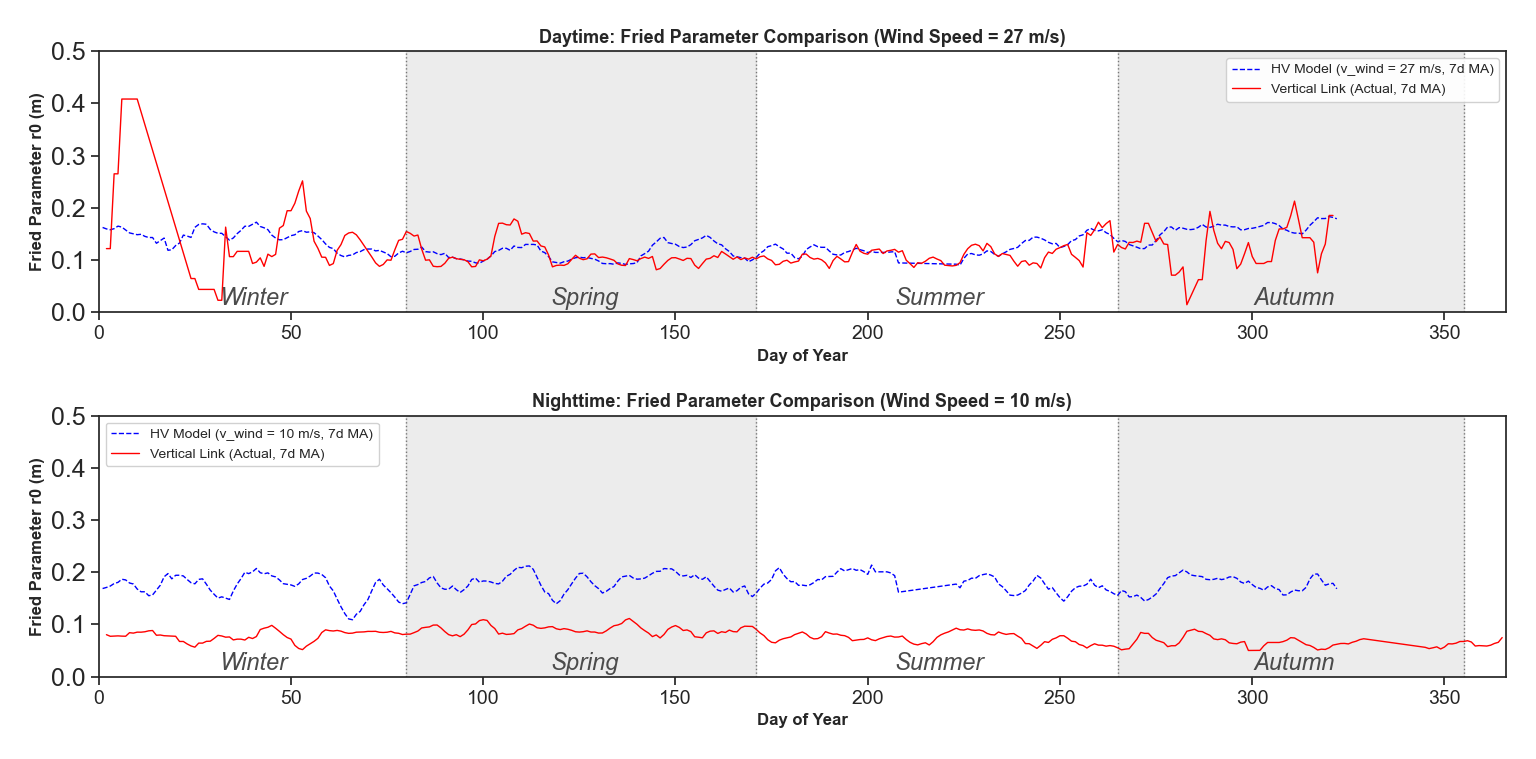
The daytime model performed well, particularly during spring and summer, with a mean normalised error of μ = 0.009. The nighttime model was more consistent (lower error variance, σ = 0.022) but systematically overestimated the Fried parameter, suggesting a correctable bias. Overall, the model is a useful tool for predicting vertical availability from horizontal measurements, though its accuracy degrades during winter months when data is sparser and near-ground conditions are less stable.
Key Findings
- Horizontal link: Winter months dominate availability. December ranks first (92.9% of time in very weak turbulence), with performance dropping significantly from March onwards. Nighttime availability is near-constant across all seasons.
- Vertical link: Spring months offer the best availability, with March ranking first. Unlike the horizontal link, vertical performance correlates more strongly with daylight duration than season, and is better during the day than at night.
- Day vs. night: The two links behave oppositely — the horizontal link performs best at night (less thermal convection), while the vertical link performs best during the day (more observation windows, less near-ground turbulence).
- Modelling: The Hufnagel-Valley model successfully approximates vertical link availability from ground measurements, with the daytime version proving more accurate overall. A machine-learning extension incorporating weather data (cloud cover, humidity, temperature) is recommended for further improvement.
Publication Status
This paper was produced as part of the Test, Analysis and Simulation (AE2224-I) course at TU Delft's Faculty of Aerospace Engineering. It is currently under review by faculty and is being prepared for submission to a peer-reviewed journal. A Google Scholar link will be added here upon publication.
Project Details
Technologies
Python, Research, Data Analysis
Category
Aerospace Engineering
Status
Under Review
Institution
TU Delft